Find a better market position with portfolio analysis charts
How much do You know about Your product portfolio? Do You know exactly which of Your products are in which stage of life?
Do You know which areas are growing and which
are profitable? Do You know whether it is desirable
to strive for market leadership, to seek partners
or to increase investment? Do You know whether certain
products should better be given up? Such issues
are often visualized with portfolio diagrams.
 The
word "portfolio" can be traced back to Latin. Taken
literally, a portfolio serves to carry leaves: It
is a wallet. Today, the word is used in manifold
context when one speaks of a collection of similar
things. Most probably you will hear it in the context
of securities: A vault's content is often referred
to as a stock portfolio.
The
word "portfolio" can be traced back to Latin. Taken
literally, a portfolio serves to carry leaves: It
is a wallet. Today, the word is used in manifold
context when one speaks of a collection of similar
things. Most probably you will hear it in the context
of securities: A vault's content is often referred
to as a stock portfolio.
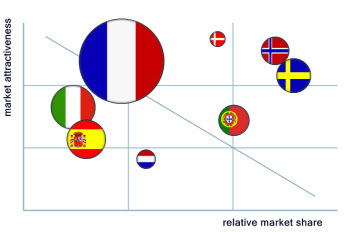
Strategic portfolio
analysis starts with similar things. This could
be a portfolio of products, industries or markets,
for instances. It is about the things by which to
make money. Usually we use the term portfolio diagram
when, as shown in the image, the considered subjects
are classified according to certain criteria. The
subjects are grouped and "similar things" are investigated.
Often we look for relationships, interactions and
developments.
Strategic decisions
In the heart of the matter this is about strategic
decisions. It is about the search of the best starting
points for product development and investment. For
example, we confront the two terms "competitive
advantage" and "market attractiveness" and use the
corresponding graph to classify our products. Portfolio
strategy is then what we make of it.
Put
more simply, we ask: In what area and what products
are we better than everyone else, closer to the
customer's requirements? To which products apply
both advantages? How can we earn more?
Which diagrams exactly?
Of course, portfolio diagrams can be found among
the strategy charts provided by meineZIELE pro,
where they can be created quickly and in unlimited
variety. However, less is often more. Therefore,
this important principle in advance: Portfolio diagrams
are only worth something if they answer our questions
and if we get into a position where we can act based
on insights. Do not start by trying to paint a colourful
image. First specify what question has to be answered
with your chart. The diagram itself can be very
simple.
 Portfolio
diagrams help you clarify the positioning and development
of products, markets and target audiences. They
allow a high density of information in multiple
dimensions and sometimes act as clearing as windshield
wipers.
Portfolio
diagrams help you clarify the positioning and development
of products, markets and target audiences. They
allow a high density of information in multiple
dimensions and sometimes act as clearing as windshield
wipers.
Anyone who knows about portfolio
strategy has at least one special, simple outline
in mind: The famous dogs, stars, cash cows, and
question marks from the portfolio analysis by the
Boston Consulting Group.
Portfolio analyses are based on many different
considerations. Example: In some parts of the purchasing,
we can easily dictate prices, in others we have
to be happy if everything is delivered on time.
Some suppliers are important to us, others are not.
Or: With some products we make the money, others
will only be profitable in the coming years and
are still loss-making today.
 So,
portfolios can be used in various areas. We then
speak of product, procurement, technology or employee
portfolios. And of course there are many other applications
and special considerations such as "early warning
portfolios". Hence, it is interesting that in some
situations actually something like "recipes" are
available.
So,
portfolios can be used in various areas. We then
speak of product, procurement, technology or employee
portfolios. And of course there are many other applications
and special considerations such as "early warning
portfolios". Hence, it is interesting that in some
situations actually something like "recipes" are
available.
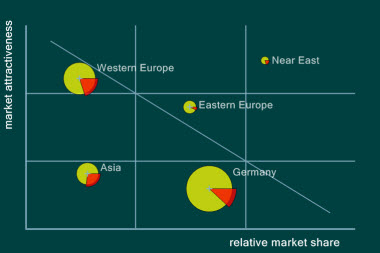
For example, the purchasing portfolio
on the right shows that there is a procurement risk
in plastics. We would actively seek for new suppliers,
agree scheduled orders and establish stockpiles.
For the modules, however, we would keep low stocks
and max the prices. Once recognized the situation,
we would have the portfolio in mind, and then we
could act basically according to the book. Literature
about strategy and controlling are available by
the pile.
Where does meineZIELE come in?
 The
example of the Boston Consulting Group shows how
simple things sometimes have to be represented if
one wants to be understood. Just the simplicity
of the approaches forces a concentrated view of
the so-called key variables. For strategic decisions
the crucial strengths and weaknesses have to be
known. At the portfolio approach, the question is:
Which business sectors have such key strengths and
which do not? Where are actual investment opportunities
and where not?
The
example of the Boston Consulting Group shows how
simple things sometimes have to be represented if
one wants to be understood. Just the simplicity
of the approaches forces a concentrated view of
the so-called key variables. For strategic decisions
the crucial strengths and weaknesses have to be
known. At the portfolio approach, the question is:
Which business sectors have such key strengths and
which do not? Where are actual investment opportunities
and where not?
The idea is to identify these
facts and to show them to oneself and others. Anyone
how has seen and understood a portfolio once will
mostly be able to make reasonable decisions without
textbook. Therefore, meineZIELE does not provide
the recipes, but will assist you in the presentation
of findings and their implementation in actions.
The often tedious data procurement on markets
and competitors is not supported as well. However,
meineZIELE helps you get these data and findings
in an engaging and understandable form. That is
what matters.
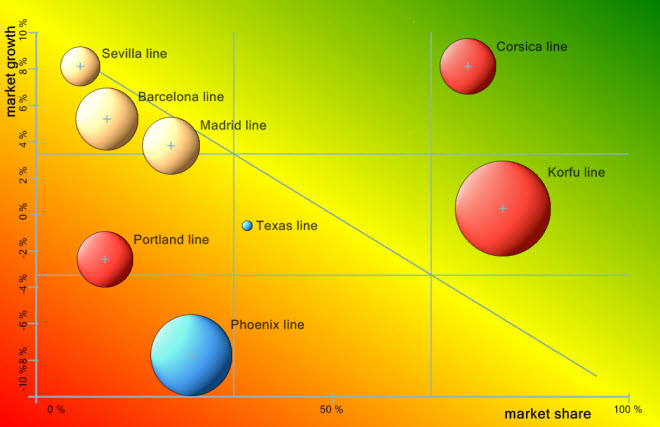
Example: Portfolio strategy of the BCG
The famous dogs and cows indicated in many
textbooks come from the Boston Consulting Group
(BCG), an international strategy consulting company.
The model of the BCG considers the product life
cycle in a graph which applies market growth to
market share. To the top left you will find still
new products, the so-called question marks, which
require careful selection. These are not yet financeable
with their earnings and many of them can turn out
to be flops.
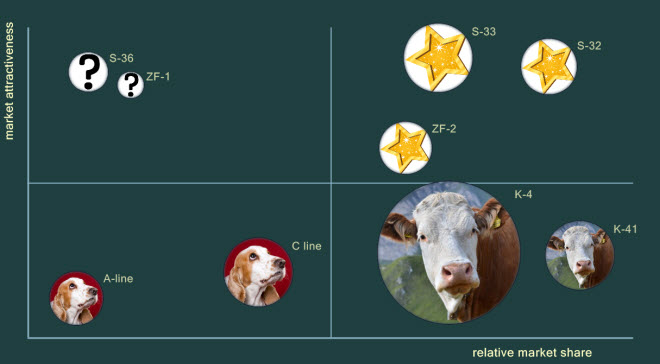
To the top right there are already established
products. With a high market share in a rapidly
growing market, they are actually the stars. They
have left the stage of uncertainty. Investments
are worthwhile.
To the bottom right, at a
high market share in a saturated market one skims
what the market will bear. The cash cow is the right
image for that.
Finally, there are the poor
dogs to the bottom left. Low growth and low market
share suggest gradually taking these products from
the market.
Of course, there is a lot of
academic controversy about where the dividing line
between the segments has to be drawn and whether
the market share shall be absolute or relative.
The user can choose by himself. The labels and scale
of the graph are freely adjustable. (Recommended
reading: "The Boston Consulting Group On Strategy")
From insight to action
 Actually,
it is not difficult to cobble together portfolio
diagrams using any graphics software. But there
are some outstanding features and comfortable, convenient
display options, which make meineZIELE the top choice
for developing portfolio strategy.
Actually,
it is not difficult to cobble together portfolio
diagrams using any graphics software. But there
are some outstanding features and comfortable, convenient
display options, which make meineZIELE the top choice
for developing portfolio strategy.
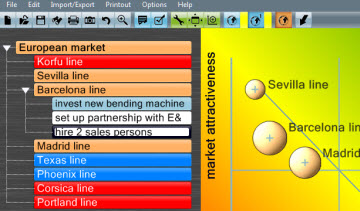
You could
probably find elaborated but never implemented strategies
in some drawer of virtually every company. Not with
mZ Pro. In mZ Pro a portfolio consideration (and
all other strategic planning) is directly included
in Your outline of projects, goals and tasks.
In meineZIELE, the portfolio elements are directly
connected with the structured entries. You can take
measures concerning the displayed elements and include
them in the outline as a subordinate goal. Two mouse
clicks activate the task and bring it to the daily
schedule. Switch from theoretical insights to powerful
action in a single second.
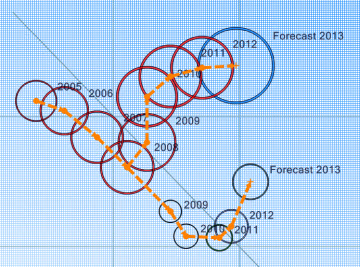
Hierarchical portfolios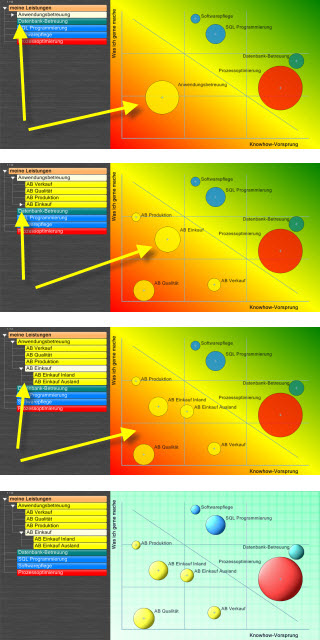
Even the portfolio itself may be hierarchical.
In the figure to the right you can see how easy
an element is broken into its components with two
mouse clicks. That is ideal for discussions with
the portfolio on the canvas.
The knowledge
gain can be enormous with hierarchical portfolios.
That is because sometimes little market segments,
which would be put somewhere else generously, lie
in a completely different area of the diagram and
require a different strategic response.
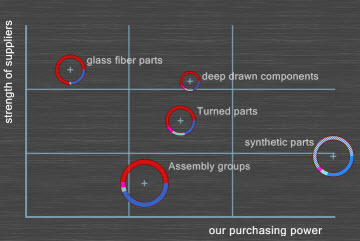
Design options
With meineZIELE, a portfolio diagram can be designed
any colorful or conservative. Also the portfolio
circles themselves can have a number of different
properties.
The position of a circle could
indicate the market share and growth opportunities
of a product. Then you could choose the size of
the circle for the sales, colours for different
product groups, and so on.
If the circles
lie close together or overlap each other, it is
often advantageous to choose rings. Using sectors
or ring segments, even the sales share of the main
product or a product group can be highlighted.
Remember, however: Any information is only worth
something when it allows us to act. And a graph
is at its best when nothing can be left out anymore.
In any case, meineZIELE provides all the options.